How to Track Social Media Traffic Using Google Analytics in 2020?
Get link
Facebook
X
Pinterest
Email
Other Apps
Do you know if your social media efforts are working? Wondering how to track link clicks from social traffic?
In this article, you’ll discover how to use UTM tags to measure your social media traffic with Google Analytics. How to Track Social Media Traffic Using Google Analytics by Chris Mercer on Social Media Examiner.
Why Measure Your Social Media Traffic?
Measuring your social media traffic will help you determine which marketing tactics are working for you and which are coming up short.
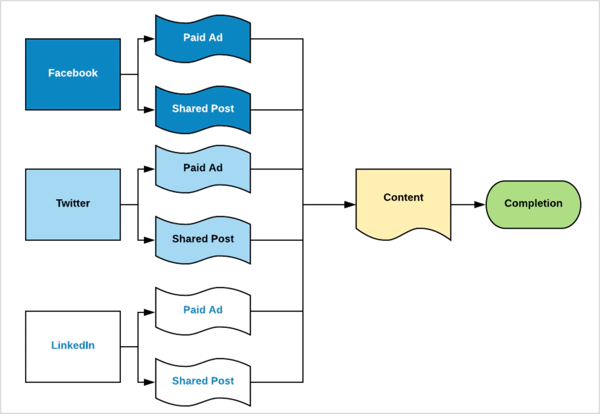
The traffic that comes from Facebook, Twitter, LinkedIn, YouTube, or other social media sources funnels into the content on your site and then triggers some sort of completion such as a lead, a purchase, or whatever you’re trying to accomplish with that traffic.
Your social media traffic will come from both paid and unpaid sources. To illustrate, Facebook traffic can come from paid ads, shared posts from your page, and maybe even posts from a group. The same can be true with Twitter, LinkedIn, and YouTube.
You can also look at social media traffic on a more granular level. On YouTube, for instance, traffic might come from specific areas of the site such as cards, the backend, or description links.
You want to measure how all of this social media traffic converts into content and ultimately into your completion goal. You can do that with Google Analytics and UTMs.
#1: View Data About Your Social Media Traffic in Google Analytics
The Source/Medium report in Google Analytics is where you’ll find all of the relevant details about your social media traffic. In this one report, you can see the identity of each traffic source, how much of an audience you’re getting from that source, how that audience is engaging with your site, and the results of those actions.
Here’s how to get started using this report.
Access the Source/Medium Report
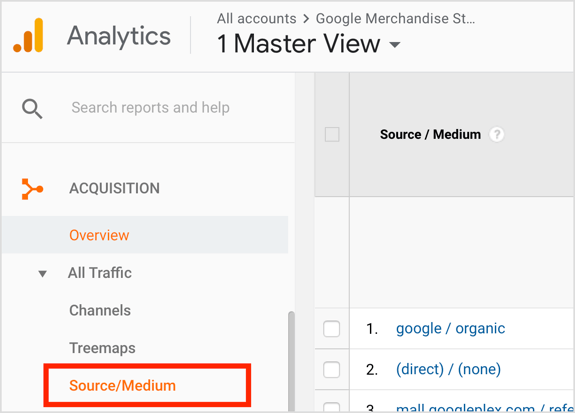
To access the report, open Google Analytics and go to Acquisition > All Traffic > Source/Medium.
Scroll down the page to see the list of traffic sources for your site. This data is divided into several different sections. For this walk-through of the report, we’ll look at some data from the Google Merchandise Store demo account.
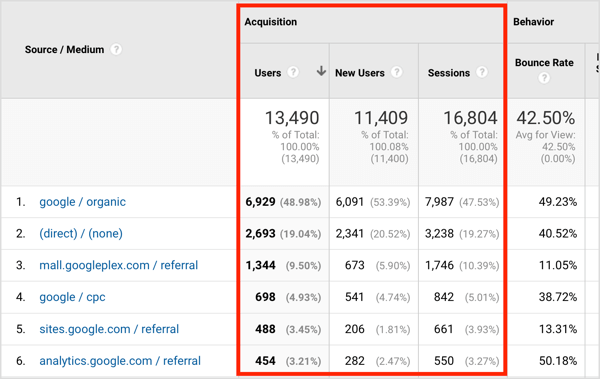
The far-left column of the Source/Medium report identifies the traffic source and the medium. You can think of the “source” as the brand of the traffic that’s coming through and the “medium” as the type of traffic.
To visualize this, the first traffic source listed below is google/organic. In this case, Google is the brand of traffic and organic is the type of traffic. For google/cpc, the traffic also comes from Google and the type of traffic is CPC, which is paid traffic.
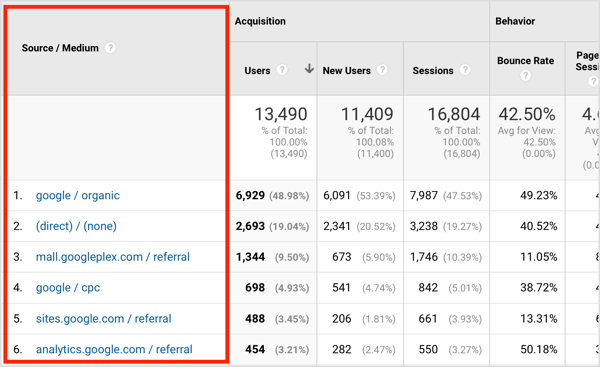
The next part of the report, Acquisition, tells you about the quantity of traffic from that source. You can see the number of users, new users, and sessions.
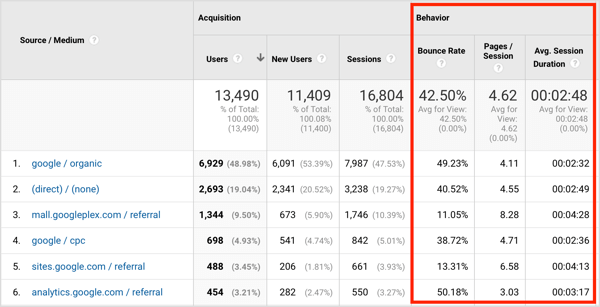
The third section, Behavior, tells you about the actions people are taking. You can see the bounce rate, pages per session, and average session duration for this audience.
Looking at the Acquisition and Behavior data together will give you an idea of the quality of the traffic from that source. For instance, you may have a source that drives a ton of traffic to your site, but those users don’t take the actions you want or leave quickly. And you might also have a source that doesn’t send you a ton of traffic but those users really engage with your message and your content. That second source is a little higher quality.
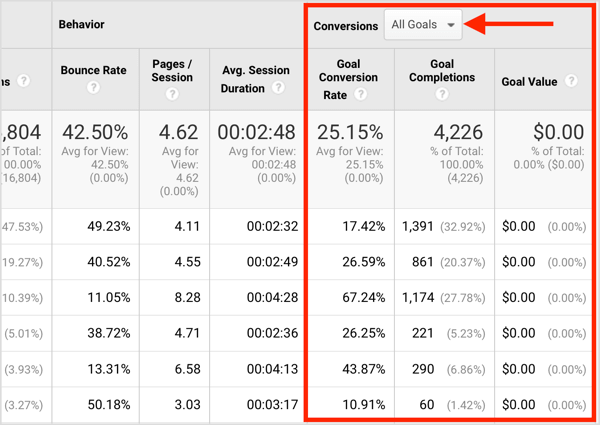
The last section of the Source/Medium report shows you the results. If you’ve set up goals in Google Analytics to measure actions like leads or purchases, this is where you can see those results. Select one of your goalsfrom the drop-down menu to compare traffic sources for different results.
Analyze the Data in the Report
Now that you’re familiar with what’s in the report, let’s look at how to analyze this data. When you review the data, don’t get caught up in the numbers. Instead, look for trends.
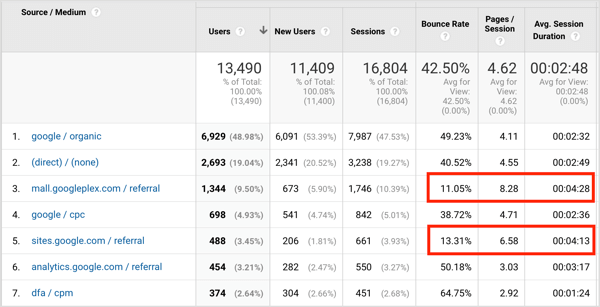
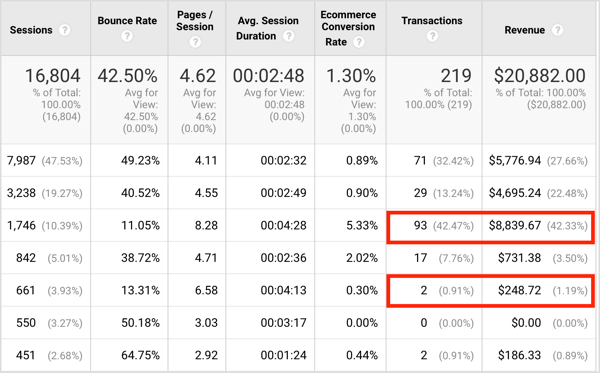
If you look at the Behavior data below, you can see that the traffic sources with the lowest bounce rates are mall.googleplex/referral (11.05%) and sites.google.com/referral (13.31%). This data indicates the audiences from those two sources are more engaged than the audiences from the other sources.
The same two traffic sources also stand out from the others in pages per session and average session duration. These audiences viewed more pages on average during a session (8.28 and 6.58, respectively), and spent more time on the site (4:28 and 4:13, respectively).
Now that you’ve determined the audiences from these two sources are really engaged, you need to find out if that translates to results. On the ecommerce side, you can see that mall.googleplex had 93 transactions for a total of $8,839, but sites.google.com had only 2 transactions for a total of $248.
While the engagement levels from the two sources are similar, the first source sent you 93 transactions and the second source only 2. That tells you the second source isn’t working as well for you as the first one. If that first source was Facebook, and the second source was YouTube, you’d want to put more of your efforts toward Facebook.
Now that you have a general understanding of how to use this report in Google Analytics, you’re ready to start tagging your own traffic.
#2: Track Your Social Media Traffic Sources With UTMs
UTM parameters are tags that you add to the links you share on social media so you can get more detailed information about your traffic in Google Analytics.
Tagging your links with UTM parameters lets you determine which source of social media traffic brings the most visitors to your site, what pages or content they’re interested in, and even more details such as how much they purchase, what they do after they purchase, where they drop off your funnel, and more.
Suppose you have a Facebook campaign and use multiple ads to send visitors to the same piece of content on your site. To determine which ad gets the most clicks, it’s easy to look at the analytics from your Facebook account to determine this metric. However, which ad gets you the most page views after the initial click? Which ad turns the clicks into subscribers or customers?
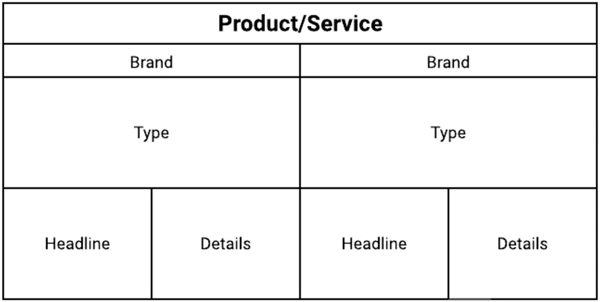
Google Analytics can show you this information if you tag your traffic. When it comes to tagging, think of the structure like this:
Product/service: The product or service you’re ultimately promoting or sending traffic to
Brand: The brand of traffic you’re using (Facebook, YouTube, Twitter, etc.)
Type: The type of traffic that brand provides, such as paid or shared traffic, or organic
Headline: The headline (or the subject line if it’s an email)
Details: The details about the traffic source
Become the Social Media Marketing Rockstar for Your Business
Meet your secret team that makes you look like a social media genius and empowers you to embrace change! We’re a genuine community of marketers from your friends at Social Media Examiner. And we’re here to support you. Think of us as your career insurance policy. We keep you focused on what matters. We make sure you won’t be left behind as the changes keep coming. Join the Social Media Marketing Society. Get access to monthly online training, expert support, and a thriving community of marketers who will empower you to succeed.
To understand how this structure translates to your social media marketing efforts, let’s look at a Facebook ad example. Here are the details for this ad:
Product/service: Measurement Marketing Academy
Brand: Facebook
Type: Paid
Headline: “Know Your Numbers”
Details: Retargeting blog readers – laptop image
You want to include the “laptop image” identifier in the details because you’re testing different images in otherwise identical Facebook ads and want to see the results of using the different images in your ads in Google Analytics. Tagging your traffic this way allows you to see details about a specific ad and what type of actions people take after clicking that ad.
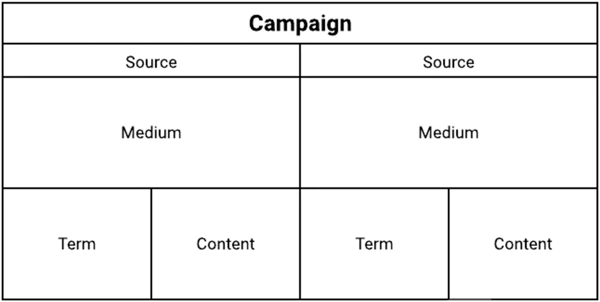
So how do these details translate to UTMs? Your product or service is the “campaign,” the brand is the “source,” the type of traffic is the “medium,” the headline is the “term,” and the details are the “content.”
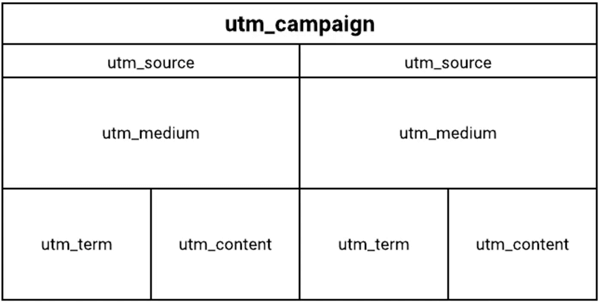
To track this information in Google Analytics, you add UTM parameters to your links:
The campaign (your product/service) becomes utm_campaign.
The source (the brand) becomes utm_source.
The medium (the type of traffic) becomes utm_medium.
The term (the headline) becomes utm_term.
The content (the details) becomes utm_content.
For the Facebook ad example, here’s how to add the UTM parameters to the link.
First, identify the source (the brand), which is Facebook in this case:
Next, identify the medium (the type of traffic). In this case, you’re using CPC, which stands for cost per click:
Follow this up with the campaign (product/service). It’s Measurement Marketing Academy, but we’ll use Academy for short:
Then add the term (headline/subject), which is Trust Your Numbers:
Finally, provide the content (details). You’re retargeting blog readers and using an image of a laptop in the ad, so you write it like this:
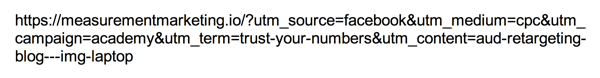
Now you need to add these parameters to the link itself. Note that the UTM parameters can be used in any order and only source/medium/campaign are required.
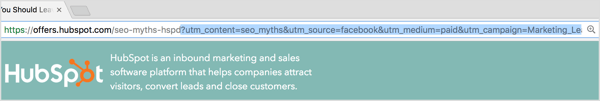
For this example, when users click the Facebook ad, it takes them to the home page at https://measurementmarketing.io. That’s the main link.
Now add a question mark to the end of the main link and then the individual UTM parameters. Separate each parameter with an ampersand. Here’s what the final URL will look like:
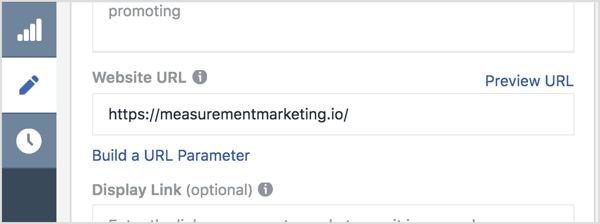
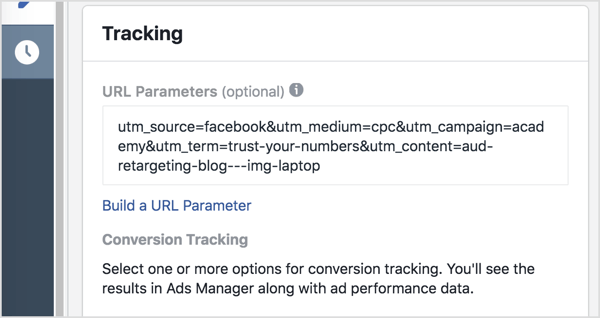
Now let’s look at how you’d use this URL when you set up the Facebook ad. In Ads Manager, type your main link in the Website URL box.
Then add your tracking parameters (everything after the question mark)to the URL Parameters box.
Now when somebody clicks on your Facebook ad, that information will come through your Google Analytics.
If you open the Source/Medium report, you can see where the traffic is coming from (Facebook), what specific ad it’s coming from (the “Trust Your Numbers” ad with the laptop image that’s retargeting blog readers), what the users’ actions are, how much traffic is being sent from that traffic source, and ultimately what the results of that traffic are.
#3: Create Your Own UTMs With the UTM Builder Tool
The good news is that there’s an easier way to create UTMs for your campaigns. The UTM Builder tracking tool will keep your UTMs structured and ensure all of your information is organized and in one place.
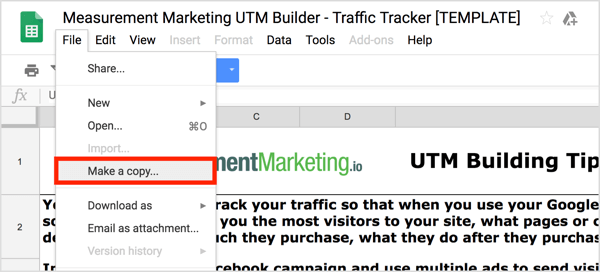
To use this method, open the UTM Builder and then choose File > Make a Copy to create your own copy so you’ll be able to edit it.
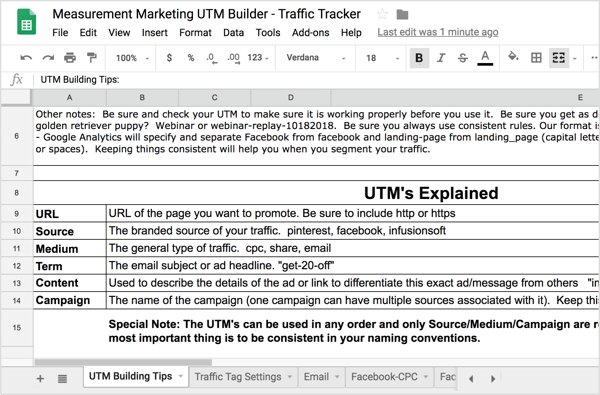
On the first tab, UTM Building Tips, you’ll find a recap of the UTM information discussed earlier.
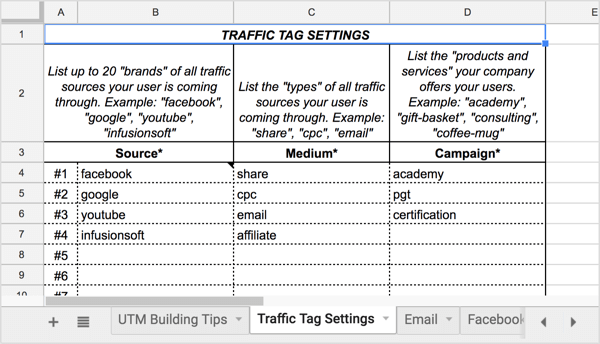
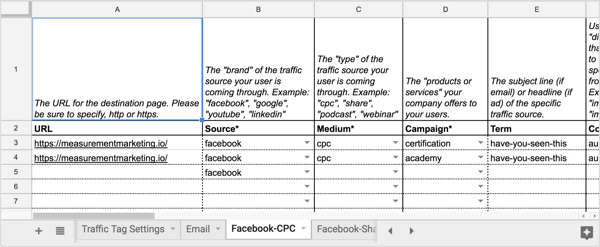
To start customizing this sheet, open the Traffic Tag Settings tab to set up your core traffic tag settings. In the Source column, list the “brands” of traffic sources you use (Facebook, YouTube, etc.). In the Medium column, add the types of traffic youuse (share, CPC, email, etc.). In the Campaign column, list the products or services you offer.
The sources, mediums, and campaigns you list on this tab will show up in drop-down lists on the other tabs of this sheet, as you’ll see in a second.
Once you’ve filled in that information, you’re ready to start creating your UTMs. To understand how to use this tracking tool, let’s use it to create the UTM for the Facebook ad example from earlier. Start by opening the Facebook-CPC tab.
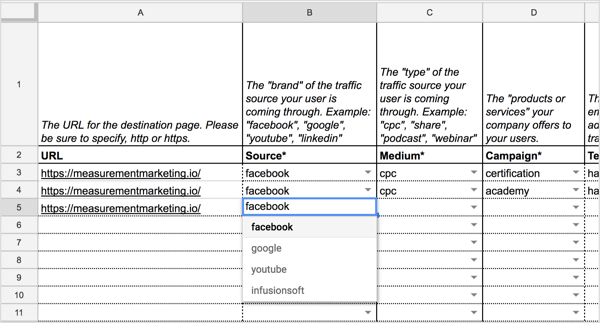
In the URL column on this tab, type in the URL for the ad’s landing page. Then in the Source column, select the social media traffic source (Facebook, in this case) from the drop-down list.
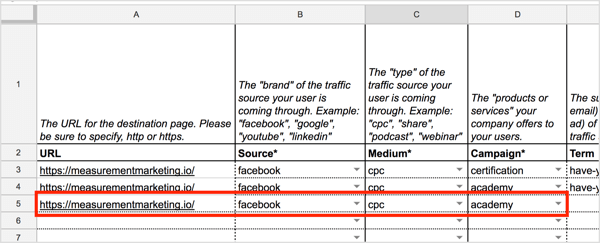
In the Medium and Campaign columns, select the medium (CPC) and campaign (academy) from the drop-down lists.
Here’s what your sheet looks like at this point:
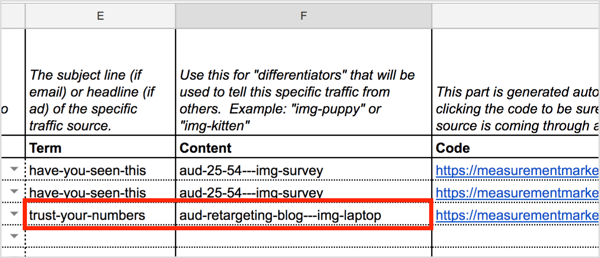
Next, type in your term and add the details about your content.
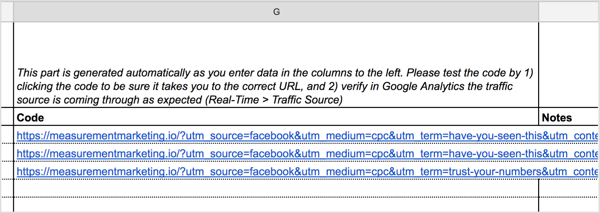
As you define the different parameters, the spreadsheet will automatically generate the URL for you in the Code column. Click the code in the spreadsheet to test it and make sure it opens to the correct landing page.
Tip: As you add UTMs to your spreadsheet and begin tracking, you may want to highlight the content and campaigns that bring you the most social media traffic. Keeping them in this spreadsheet will help you remember specific details you may need to know later on.
Scoping CSS using Shadow DOM in 2021 As a front-end developer working with a large team, managing styles for components is one of the big problems I have come across. Having a shared component style file can often result in styling conflicts, since it is very common for two developers to use the same name to name a style class. CSS will not throw in an error for this. As a consequence, in the parts where it takes time to overcome them, I have experienced unexpected use of style. The technique I will add next will give you a solution to prevent collisions with the CSS label. What is a Shadow DOM? Shadow DOM is part of the DOM, which is capable of isolating JavaScript and CSS . If you have heard of iframes , Shadow DOM is also something that has similar capabilities. Just like in iframes , by default, styles within a shadow DOM won’t leak out and styles outside ofit won’t leak in. There are ways to inherit some styles from outside of the Shadow DOM too, if required. Structure of a ...
Fintech 4.0 — How Technology Is Reshaping The $5 Trillion Insurance Sector The idea of protection traces all the way back to antiquated history with the primary type of composed strategy showing up in the code of King Hammurabi, about 3,800 years prior. Vendors who acquired assets would pay a little charge to moneylenders, and in return, the banks would drop the advance on the off chance that merchandise was lost. Quick forward to the present time, and it is an almost $5 trillion worldwide industry. It is frequently considered as a sluggish traditionalist area impervious to change, however, the phenomenal speed of development is significantly changing the protection business scene. Changing socioeconomics and shopper conduct, move from resource possession to leasing, expanded interconnectedness, the rise of shared economy and Airbnb plans of action, are profoundly affecting the area. A.I., IoT, and decentralized record advancements (DLTs) are key empowering agents for the area to react...
In the light of my previous post “ Secure React SPA using Azure Endpoints with Authorization code flow ” I realized that configuring multiple providers with you application needs lots of coding and configuration and specially when you want to stick with Authorization code flow for all the providers. While Azure, Google supports a request from cross origin requests in a way and on other hand Facebook strictly doesn’t support it. (So we needed to create a proxy server to modify CORS policy to get your request accepted). 1. Introduction Thanks to WildFly developer community for developing a open source project Keycloak . “ Keycloak is an open source software product to allow single sign-on with Identity and Access Management aimed at modern applications and services” as from Wikipedia. All you need to do is keep Keycloak application server running on a machine whether it is on same domain or cross domain doesn’t matter. In this post we are going to learn about running a Keycloak...
 Meet your secret team that makes you look like a social media genius and empowers you to embrace change! We’re a genuine community of marketers from your friends at Social Media Examiner. And we’re here to support you. Think of us as your career insurance policy. We keep you focused on what matters. We make sure you won’t be left behind as the changes keep coming. Join the Social Media Marketing Society. Get access to monthly online training, expert support, and a thriving community of marketers who will empower you to succeed.
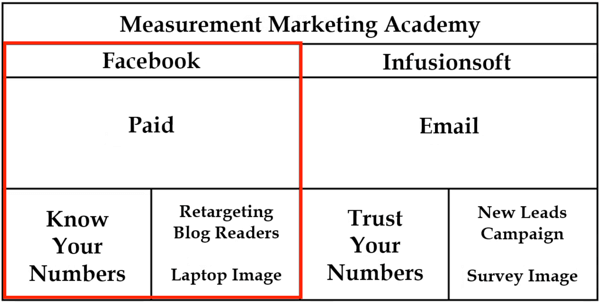


Comments
Post a Comment